Statistics Assignment
First, list the general steps from your textbook of hypothesis testing at the top of your paper. You are doing hypothesis testing for the whole assignment, so the steps you list need to be followed in each problem.
Question 1
A sample of 64 account balances of a credit company showed an average balance of $1,125 with a sample standard deviation of $126.
- State your “givens” for the prompt.
- What kind of test (t or z values) will you use, and why?
- Is this one-tailed or two-tailed, and how do you know?
- Formulate the hypotheses that can be used to determine whether the mean of all account balances is significantly different from $1,200.
- Compute the test statistic. Show your formula and what numbers you plugged in.
- Using the p-value approach, what is your conclusion? Let α = .05.
Question 2
This is a good resource for this problem. https://stattrek.com/hypothesis-test/difference-in…
p. 485 may also help.
During the recent primary elections, the democratic presidential candidate showed the following pre-election voter support in Alabama and Mississippi.
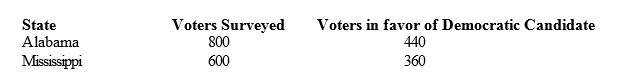
- We want to determine whether or not the proportions of voters favoring the Democratic candidate were the same in both states. Provide the hypotheses (both null and alternative) Then
- Calculate the proportion of voters in favor of the Democratic candidate for each state.
- I recommend going to the website above for guidance. I want to see the work in calculating the pooled sample proportion and the standard error..
- Compute the test statistic. Show your work.
- Determine the p-value (show your work from the z value to the p value); and at 95% confidence, test the above hypotheses.
- State your conclusion. Do we reject or fail to reject the null hypothesis? Why?
Question 3
In order to estimate the difference between the yearly incomes of marketing managers in the East and West of the United States, the following information was gathered. The values of 72 and 78 are means.
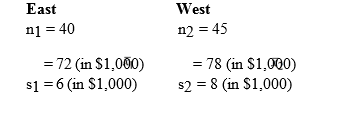
- Develop an interval estimate for the difference between the average yearly incomes of the marketing managers in the East and West. Use α = 0.05. You will need to state your hypotheses.
- Show your calculation for the degrees of freedom
- Show your calculation for the interval including the formula and how you plugged in the numbers.
- At 95% confidence, use the p-value approach and test to determine if the average yearly income of marketing managers in the East is significantly different from the West. Show the calculation of p. Should we reject or fail to reject the null hypothesis? Why?
Question 4
For this assignment, you will need to reference the data in the ROI Excel spreadsheet. Download it here.
You are doing hypothesis testing. Make sure that you have all steps of hypothesis testing.
Using the ROI data set:
- For each of the 2 majors test the hypothesis at the 5% significance level:
- The mean ‘Cost’ for a college is $160,000. Be sure to interpret your results.
- List your givens – n, standard deviation, alpha…
- Provide the formula you will use. Why are you using that formula? How does it fit the situation?
- Show how you have plugged in the numbers.
- What is your computed test statistic?
- Show the computation of the p value.
- Will you reject or fail to reject the null hypothesis. Why?
- For Business versus Engineering majors conduct a two sample test of the hypothesis at the 10% significance level (assume the variances are not equal):
- The average ’30-Year ROI’ for Business majors is less than for Engineering Majors. Be sure to interpret your results.
- Make sure to state your givens.
- State your null and alternative hypotheses.
- Show which formula you used.
- Why did you reject or fail to reject your null hypothesis?
- In a highlighted box, make sure that you are including your findings. What do they mean in terms of ROI? What hypotheses were rejected? What does that mean in terms of ROI? What hypotheses failed to be rejected? What does that mean in terms of ROI?
Do you need a similar assignment done for you from scratch? We have qualified writers to help you. We assure you an A+ quality paper that is free from plagiarism. Order now for an Amazing Discount!
Use Discount Code "Newclient" for a 15% Discount!
NB: We do not resell papers. Upon ordering, we do an original paper exclusively for you.